Smart Volume Ratio — Recognizing Order Flow Relationships
The Trader's Field Manual explores how order flow can reveal the behavior of market participants and provide additional evidence about the likelihood of continued price expansion.
Smart Volume Ratio (SVR) provides a visual representation of buying and selling activity through its histogram and chart background colors, making it easier to recognize changes in participation and developing order flow relationships.
One particularly useful observation is the relationship between ABCD price structures and the dominant order flow cycle. When these relationships develop early in a directional expansion, they can provide additional evidence that the market is maintaining its underlying structure.
The annotated chart below illustrates these relationships, including the drop-in and break behavior of SVR during developing price expansions.
The objective is not to treat order flow as an independent trading signal, but to recognize how participation, price structure, and market expansion interact.
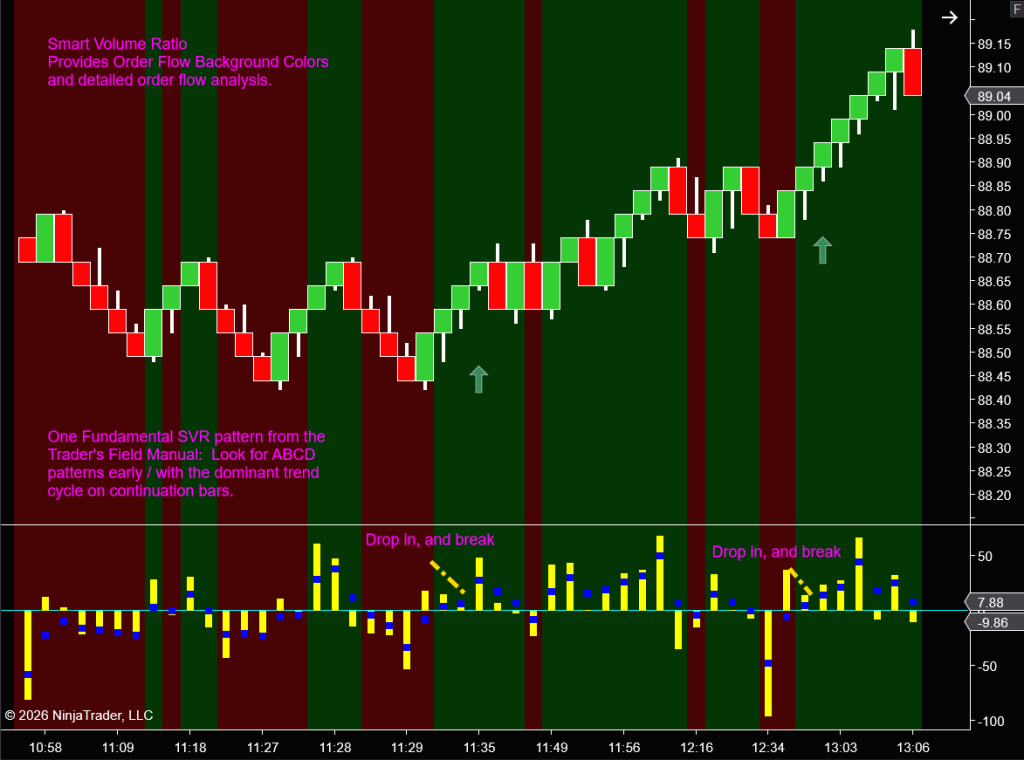
As you examine the chart, notice how volume relationships develop within ABCD price structures, particularly where Smart Volume Ratio drops in and then breaks in the direction of the dominant cycle. These relationships, along with Background color patterns, can provide additional evidence about market participation. The important question is how order flow, price structure, and momentum work together to reveal whether the market is maintaining its expansion or beginning to encounter opposition.
Return to The Trader's Field Manual — Chart & Research Resources
